
Choosing how to benefit from Triple Harmonic Injection (THI)
Power flow in a transmission line is approximately given by:
P = 3 V2 Sinδ / X
where V is the working line-to-ground voltage,
δ is the phase angle difference between the ends of the line and
X is the reactance of each phase of the line.
A phasor diagram illustrating the operation (and origin) of this equation is given above. The sending end phasor, E, is advanced by angle δ with respect to the receiving end phasor V. This creates a voltage difference between the sending end voltage waveform and the receiving end voltage waveform. This voltage when applied to the reactance of the line causes a current I to flow. The current is approximately in phase with V and so power is transmitted. To obtain exactly in-phase current E should be a little longer than V. The maths employed here is simplified to make a general point.
THI enables the amplitude of the fundamental of the line-to-ground voltage waveform to be increased by 15.6% with no accompanying increase in the amplitude of the overall (combined) waveform.
There are a number of ways this can be employed to advantage.
We assume that X remains unchanged but δ is variable (and V is increased in all cases by 15.6%).
(1) Keep δ unchanged.
The maximum power capability of the line, given approximately by P = 3V2 Sinδ / X, is increased by 33%.
The power equation, P = 3V2 Sinδ / X, can be rewritten as P = 3 V ( V Sinδ / X ).
( V Sinδ / X ) corresponds closely to the current in each phase.
So increasing the line-ground voltage by 15.6% also increases the phase current by 15.6%.
Power loss in the wires due to resistance is given by Pd = I2R.
Hence Pd is increased by 33% if the wire size is unaltered.
To bring the I2R losses back to their original value the conductor cross-sectional area will need to be increased by 33% (i.e. the diameter of the wires will need to be increased by 15.6%).
The VA rating of the transformers at each end of the power line will need to be increased to match the new voltage and current requirements.
(2) Reduce δ (reduce Sinδ by 15.6%).
The maximum power capability of the line, given approximately by P = 3V2 Sinδ / X, is increased by 15.6%.
The power equation, P = 3V2 Sinδ / X, can be rewritten as P = 3 V ( V Sinδ / X ).
( V Sinδ / X ) corresponds closely to the current in each phase.
So increasing the line-ground voltage by 15.6% increases the phase current by 15.6% but reducing Sinδ by 15.6% negates this.
Power loss in the wires due to resistance is given by Pd = I2R and is unchanged since I is unchanged.
The VA rating of the transformers at each end of the power line will need to be increased to match the new voltage but not the current (unchanged). Hence in the retrofit situation the transformer voltage may be boosted on the THI-line side by booster transformers. The reduction in δ may also be welcome as stability (in response to a fault condition) is improved.
(3) Reduce δ (reduce Sinδ by 33%).
The maximum power capability of the line, given approximately by P = 3V2 Sinδ / X, is altered by 0% (unchanged)
The power equation, P = 3V2 Sinδ / X, can be rewritten as P = 3 V ( V Sinδ / X ).
( V Sinδ / X ) corresponds closely to the current in each phase.
So increasing the line-ground voltage by 15.6% but reducing Sinδ by 33% results in a 15.6% reduction in line current (but the power rating of the system remains the same).
Power loss in the wires due to resistance is given by Pd = I2R and hence the I2R losses in the conductors (and the transformers) are reduced by 33%. The reduction in δ may be also welcome as stability (in response to a fault condition) is improved.
Similarities with quadrature voltage injection and related benefits.
In the power equation, P = 3 V ( V Sinδ / X ), the voltage component, V Sinδ, is largely in quadrature (leading) with the receiving-end voltage waveform. It is applied across the line reactance X to produce a current in the lines which is largely (ideally) in phase with the receiving-end voltage waveforms, and hence conveys power.
A Discussion Document on:
The Use of Third Harmonic Injection to Increase Grid Transmission Line Power Rating and Reduce Conductor Losses
Executive Summary.
Adding 1/6th third harmonic to the ac supply waveform permits the maximum theoretical power capability of a transmission system to be increased by 33%. Alternatively the power can be kept constant and voltage increased and the current reduced, thereby lowering line losses due to resistance by up to 33%. Third harmonic injection gives some of the benefits of DC transmission (i.e. approaching full use of the line-ground voltage capability) while keeping the immense advantages of AC. Third harmonic injection in a section of a transmission system allows that section to operate for most of each cycle at close to peak allowable voltage. We describe various injection methods as well as the practical difficulties involved. The design of the equipment required for implementing the technology is discussed as well as operating principles. The study points to a need for modelling with authenticated data to permit an evaluation of the potential of this technology.
1 Introduction
Adding 1/6th of third harmonic lowers the peak value of a sinusoidal waveform by a factor of 0.866. Restoring the combined waveform to the allowable line-to-ground peak value for the transmission line raises the fundamental voltage by a factor of 1.156. This principle has been widely used for many years to raise the output voltage in three-phase inverters thus permitting the use of conventional-voltage motors in ac variable-speed drives [1].
The Pmax of a power transmission line is proportional to V2. Therefore the raising of the fundamental voltage theoretically permits Pmax to be increased by a factor of 1.33. Alternatively the power (or VA rating) can be kept the same and line conductor losses may be reduced if the fundamental voltage is raised by 15.6% and the current reduced by 15.6%. I2R losses are thereby reduced by 33%. Conductor heating is thereby reduced. Reference [2] identifies reduced sag as a benefit of operating in this mode. In [2] the authors note that signal dispersion could distort the waveform along the line if the line is considered to be a transmission line with distributed L and C. In this present document we have in effect used the conventional lumped parameter (or π ) model and we recognise that distributed capacitance may have to be taken into account as well as the possibility of resonance resulting from the insertion of triple-frequency voltages and currents.
1.1 Waveforms
Figure 1 shows line-to ground waveforms in one phase of such a system. In Figure 1 waveform (a) is the line-ground waveform before the addition of the third harmonic. Waveform (b) is the waveform obtained when a 1/6th third harmonic is added and the resulting waveform amplified by 1.156. Waveform (c) is the fundamental component of the resulting waveform. In implementation, the fundamental is created by increasing the voltage of the output winding of the relevant transformer and adding 1/6th harmonic to that via a third harmonic injector which is described later in this document. The resulting line-line voltage waveform is sinusoidal (since the third harmonics injected into each of the lines are identical in amplitude and phase). Figure 1 illustrates this process.
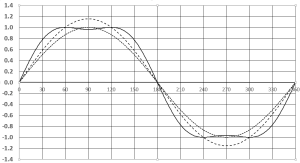
Fig. 1 (a) Normal sinusoidal waveform with 1pu amplitude (dotted) (b) With 1/6th third harmonic added and amplified by 1.156 (solid) (c) Fundamental of waveform (b) (dashed) Horizontal axis – degrees.
In this document we refer to third harmonic injection and triple-frequency injection synonymously. We use the notation
‘1f ‘ to indicate fundamental frequency (i.e. 50Hz or 60Hz) and ‘3f’ to indicate triple frequency.
1.2 Implementation
There are two basic methods by which the third harmonic may be injected: (a) series injection (b) star point injection.
In series injection the triple-frequency component is injected into each line by an element (e.g. transformer) connected in series with the line. This arrangement has the advantage that it can be employed where the three-phase transformer windings at either end of the line are connected in delta. However this arrangement has the disadvantage that the injectors carry full line current (positive, negative and zero-sequence components) at 1f and zero-sequence (cophasal) components at 3f.
In star point injection, as shown in Figure 2, the triple-frequency component is injected at the star point of star connected transformer windings at each end of the transmission line. The positive and negative-sequence currents sum to zero and only 1f zero-sequence and 3f zero-sequence (cophasal) currents are carried by the injector. Under normal operation unbalanced loads will cause some zero-sequence 1f current to flow and this must be budgeted for in the injector specification. Very large 1f zero-sequence current may flow in the injector under fault conditions but these currents will be short-lived and the injectors can include a protection mechanism to avoid damage (e.g. back-to-back SCRs as a bypass). Hence this study is centred on the star point injection method which is illustrated in Figure 2.
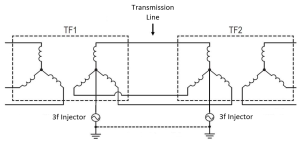
Fig. 2 Star point injection method.
TF1 is the sending-end transformer and TF2 the receiving-end transformer (though it will be understood that power flow may be bidirectional). Star-point injectors are connected between ground and the star points of the three-phase windings of the transformers at the two ends of the transmission lines. If only the sending-end star point injector was present the line-to-ground waveform at the sending end would have the required form (as shown in Figure 1). However when power is flowing along the transmission line, the phase of the receiving end 1f voltage waveform will lag the 1f waveform at the sending end. The 1f and 3f waveforms at the receiving end will not have the required phase relationship to achieve the ideal waveform shown in Figure 1. Hence a 3f injector must also be applied to the star point of TF2. This ensures that the phase between the 1f and 3f waveform at the star point of TF2 is correct – and that it will therefore be correct at every point along the line. The phase difference between the two 3f injectors will be three times that of the phase difference between the 1f waveform at the two ends of the line. This phase difference will result in a small 3f current flowing between the injectors and through the earth (or through a ground wire if required – shown dotted in Figure 2). This current will also be responsible for a small power flow between the injectors. The injectors must therefore be capable of providing (and receiving) this power. Also the injectors must be capable of providing the current at 3f resulting from the capacitance between each line and ground. The transmission line of Figure 2 is the only section of the greater transmission system in which the line-ground voltage waveform contains a third harmonic (or 3f component).
1.3 Injector Considerations
It is usual for the star point of star-connected three-phase transformer windings to be connected solidly to ground (at least at one end of the transmission line) in order to establish the potentials of line phases with respect to ground. In the proposed triple-harmonic injection arrangement the direct connection to ground is replaced by a 3f injector as shown in Figure 2. The function of this injector, as well as injecting a 3f waveform of the required amplitude and phase, must be to emulate a direct (zero impedance) connection to ground with respect to the 1f three-phase system. Figure 3 shows an arrangement which meets this requirement [3].
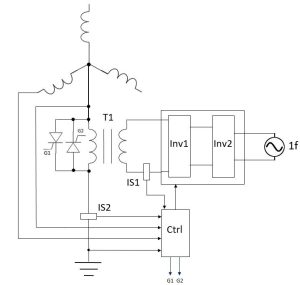
Fig. 3 Star point injector circuit.
In the circuit shown in Figure 3 a pair of back-to-back inverters connect a mains supply taken from the transformed grid to the injection transformer T1. Inv1 drives T1 at 3f. Inv2 provides a power link (bidirectional) to Inv1. The control circuit senses the voltage across the secondary of T1 and if a voltage at 1f appears across the secondary it instructs the inverter Inv1 to also send through the primary winding a current at 1f so that the Ampere turns at 1f in the secondary winding are exactly cancelled by Ampere turns at 1f in the primary. Hence no voltage at 1f appears across the secondary winding of T1 and a virtual solid connection to ground (i.e. star point earthing) is achieved. The back-back SCRs are activated in the case of a fault and large zero-sequence currents at 1f. In addition in this circumstance Inv1 can be turned off and T1 allowed to saturate providing a further low-impedance grounding path.
2 Analysis and Operating Mode Choices
2.1 Operating Mode choices
Power flow in a transmission line is approximately given by:
P = 3 V2 Sinδ / X and Pmax = 3 V2 Sinδmax / X
where V is the working line-to-ground voltage, δ is the phase angle difference between the ends of the line and X is the reactance of each phase of the line. There is a broad range of possibilities as to how the 15.6% increase in V, due to the adoption of triple harmonic injection, may be used [4]. X is related to the construction of the power line and is fixed. If δ is unaltered then the extra line-ground voltage will increase Pmax by 33%. However, the power equation can be broken up into two parts to give:
Pmax = 3 V x V Sinδmax / X
V Sinδmax/X approximately represents the line current. Hence this increase in power comes at the cost of increased line current (by 15.6%) and hence line losses are increased by 33% if the conductor diameter is not changed. Hence in a retrofit situation, as well as changing the transformers (to achieve higher 1f line-ground voltage on the side employing the third harmonic injection and to accommodate 33% extra VA) the line conductors may need to be changed also. This suggests that the third-harmonic injection technique is most usefully employed in new-build situations. However, the ability to delay CAPEX could justify the cost involved in a retrofit situation.
Nevertheless, there is an alternative operating mode which may be more applicable to retrofit situations. If Pmax is kept constant while V is increased, this effectively requires a decrease in the line current by 15.6% (achieved by a 33% reduction in Sinδmax ) and the I2R losses are therefore reduced by 33%. So without having to replace the conductors worthwhile energy savings may be achieved. There is an incidental benefit in that the decrease in δ improves the stability margin of the line.
2.2 Circuits at 1f and 3f.
Since there are voltage sources at the fundamental frequency and at triple frequency there are therefore two identifiable circuits at these frequencies (1f and 3f). One circuit is a three-phase circuit consisting of three wires with no return path (i.e. no neutral) since the positive-sequence and negative-sequence currents sum to zero. With star point earthing at each end of the transmission line there is potential for zero-sequence currents to flow. This is a factor which could increase the required current rating of the 3f injectors if the normal load is significantly unbalanced. However, while in Figure 2 the non-triple-harmonic-injection side of TF1 and TF2 are shown as also being star, one or both could be in delta which would provide an obstacle to zero-sequence currents. The VA rating of the injectors is given by the voltage rating (which is 1/6th of the 1f line-to-ground voltage) multiplied by the current rating. This current rating will be the rms total of the If zero-sequence current, the 3f current due to phase shift between the 3f voltage waveforms at each end of the line, and the capacitive currents at 3f due to the line-ground capacitance of each line. As will be seen in section 3.2 the voltage rating of the injectors will have to be increased somewhat (above 1/6th of the 1f line-to-ground voltage), due to the voltage drop at 3f across the zero-sequence reactance (at 3f) of the three-phase transformers at each end of the line.
2.2 Analysis model.
Since there are voltage sources at the fundamental frequency 1f (i.e. 50 Hz or 60Hz) and at triple frequency 3f, there are therefore two identifiable circuits at these frequencies (1f and 3f). Figure 4 shows the layout and main components of these circuits.
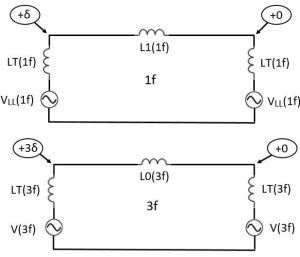
Figure 4. Equivalent circuits of the power system at fundamental frequency (1f) and triple frequency (3f).
In Figure 4 the upper circuit is based on the traditional single-phase equivalent circuit of a three-phase power system. Resistance is ignored. The lower circuit is the equivalent circuit of the triple-frequency circuit which is in reality a single-phase circuit. In the upper (1f) circuit the three lines of the power system are represented by L1 which numerically will be a reasonable representation of the inductance of each line. Line-to-line voltage is used as is the convention in the single-phase equivalent circuit. LT represents the leakage inductance of the transformers. There will be inductance behind the 1f voltage sources but that is not relevant here.
In the lower (3f) circuit L0(3f) represents the inductance of the three lines in parallel – i.e. the zero-sequence inductance of the three-line power system. Zero-sequence inductance is applicable here since the triple-frequency currents are cophasal in the three lines. The return path shown in the upper (1f) diagram is an artefact of the equivalent circuit and is not real, whereas in the lower (3f) circuit diagram it is real. It is constituted either by a ground current path or possibly a physical ground wire which assures that a low resistance path is provided for the 3f current which will flow around the 3f loop. The value of L0(3f) will to some extent be determined by the characteristics of the return path. When power is being sent in the 1f (upper) circuit the phase angle of the voltage waveform at the sending end will lead the phase angle at the receiving end by angle δ. In this situation in the 3f (lower) circuit the sending-end phase angle will be 3δ ahead of the receiving-end phase angle.
The 3f (lower) circuit diagram illustrates a possibly significant consideration to be addressed in planning third-harmonic-injection systems. Due to the need to maintain a phase angle difference of 3δ at 3f between the sending end and receiving end of the transmission line, and also due to the requirement that the 3f line-ground voltage waveform shall have an amplitude of 1/6th of the 1f line-ground voltage waveform, a 3f current will flow around the circuit. This current will flow through the zero-sequence leakage reactance ( LT(3f ) ) present in the three-phase transformers at each end of the transmission lime. There could be a significant voltage drop due to these reactances requiring an increase in the amplitude of the 3f waveform produced by the 3f injectors and hence an increase in their VA rating. The three-phase transformers may be of the three-limb type without a complete magnetic path for zero-sequence flux giving them low zero-sequence inductance. However, for very high power transmission lines (for example those serving a power station) there is the possibility that one or both of the three-phase transformers at the ends of the line may consist of three singe-phase transformers in which case their zero-sequence reactance will be relatively large. On the other hand the non-triple-injection side windings could be connected in delta which would provide a short circuit path for zero-sequence currents thereby suppressing their flux-producing capability and lowering their zero-sequence reactance. If 3f flux is allowed to flow through the transformer cores this will create a tendency for the third harmonic currents to leak outside of the section of transmission line system which uses third-harmonic injection. Hence the appearance of 3f voltage across LT(3f) is doubly unwelcome. The degree to which this is a significant problem should be revealed by modelling of the third-harmonic power line section and its adjacent sections. Obtaining valid information regarding the zero-sequence inductance of three-phase transformers at 3f will be required for accurate modelling.
3 Results
3.1 Data.
By operating three-phase power lines with a low–power single-phase system superimposed, it becomes possible to increase the power handling capability of the three-phase line by up to 33% or to save 33% of line losses. How the significant items of equipment involved react to the dual role is something that needs to be determined in order to better assess the feasibility of the proposition. Until such data can be obtained by experiments with representative equipment in operating under power system conditions, projections have to be made based on normal operating conditions data [5].
3.2 Projections for injector VA ratings – capacitive load.
One item of interest when assessing the feasibility of a triple harmonic power enhancement scheme is the required VA rating of the injectors. Table 1 shows the estimate for a 220kV double-circuit grid line. 0.27 MVA (270kVA) would seem large but not when compared with the MVA rating of the line (believed to be of the order of 240MVA).
Table 1 Injector VA rating requirement for shunt capacitance
| Quantity | Value | Units |
| Line Length | 200 | km |
| Capacitance per km | 6.5 | nF |
| Injector load half line | 650 | nF |
| Injector frequency | 150 | Hz |
| Xc at 3f half line | 1.63 | kOhms |
| L-L Voltage at 1f | 220 | kV |
| L-G Voltage at 3f | 21.17 | kV |
| I(injector) at 3f | 12.97 | Amps |
| Injector MVA (each) | 0.27 | MVA |
3.2 Projections for injector VA ratings – operating the triple-frequency single-phase circuit.
We have previously noted that the single-phase 3f circuit operates on top of the three-phase 1f power transmission line, thereby enabling a theoretical increase in the maximum power capability of the three-phase 1f power line. Of further interest is the required VA rating of the 3f injectors when the 1f transmission line is transmitting substantial power and how much power the 3f single phase circuit itself transmits and at what cost with respect to the provision of equipment for the circuit (principally the 3f injectors at each end of the line). In the example in Table 2 we suppose that δ(1f) = 20 degrees at 1f and therefore δ(3f) = 60 degrees for the 3f circuit. Table 2 shows an estimation of the VA ratings of each of the 3f injectors. We suppose a 250kV, 50Hz, 200km power line with a rating of 100MVA. Estimates of the zero-sequence inductance of three-phase transmission lines vary considerably – we have assigned a value of 2.5 mH/km. A 1f transformer rating of 100MVA has been assumed and X0 (at 1f) assigned a value of 0.07pu. The injector output voltage (each injector) has to be greater than 1/6th of the 1f line-to-ground voltage by an amount necessary to overcome the voltage drop at 3f across the zero-sequence reactance (at 3f) of the each of the three-phase 1f transformers. The circuit is illustrated in the lower (3f) circuit diagram of Figure 4.
It is clear that the injector MVA rating will be dictated mostly by the current that results from 3f power and 3f VAR flow along the power line. Since the voltage amplitude of each of the two injectors is equal and fixed it will not be possible to alter the mix of power and VAR flow but it is assumed that power flow will dominate and make a contribution to the total power transmitted by the transmission line.
Table 2 Injector VA rating required for power transferred by the 3f circuit.
| Quantity | Value | Units |
| Line Length | 200 | km |
| Line Voltage L-L | 250 | kV |
| Line Voltage L-G
MVA rating |
177
100 |
kV
MVA |
| Lo (zero seq.) per km
Xo (zero seq.) at 3f V L-G (3f) V L-G (3f) Sin 3δ Total Io current at 3f Injector MVA pre boost |
2.5
471 29.5 25.5 54.2 1.6 |
mH/km
Ohms kV kV Amps MVA |
| Xo(3f) from Zbase and Xo pu | 131.3 | Ohms |
| Volts at 3f across transformer | 7.11 | kV |
| V each injector incl. boost required | 36.6 | kV |
| MVA rating each injector | 2.0 | MVA |
The 3f current in each line (18 Amps) will be small compared to the 1f line current (189 Amps) but will make a small addition to the line I2R losses. The results given in Table 2 are based on a number of assumptions and estimates and modelling will be required for every system in order to achieve accurate results.
3.3 Economic considerations
One of the options for using the THI technology is the loss-reduction mode in which, while retaining the same power rating, the line-line voltage is increased and the line current reduced in the same proportion, thus reducing I2R losses in the conductors. Table 3 contains an illustration of how much money might be saved by adopting this technique. Where a power line is used continually at or near its full power rating the calculated saving in energy costs suggest that the payback time for the cost of providing the THI system could be reasonably short.
Table 3 Possible economic advantages of using THI.
| Quantity | Value | Units |
| Line Power Rating | 1.0 | GW |
| Annual Energy Transfer (max) | 8700 | GWhr |
| Cost of energy (to sender) | 75 | £/MWhr |
| Annual value of energy sent | 657 | £M |
| % energy loss due to I2R losses | 2.0 | % |
| % I2R losses saved with THI | 33% | % |
| Value of energy saved per year | 4.34 | £M |
| Value of energy saved over 25 years | 108.4 | £M |
4 Conclusion
When adopting third harmonic injection to enhance power line performance, either in new-build or retrofit situations, there is a benefit-to-cost ratio hurdle to be overcome. Further data is required to make a full assessment of the practicality of the technique. As a prelude to practical trials, which at grid level are costly, we suggest that computer modelling is the most efficient and effective way forward. Some uncertainty regarding equipment parameters when used in this new way suggests some practical tests will be necessary to acquire appropriately valid input data. Third harmonic injection has the promise to enhance power system performance and could be an important technique to be applied widely in power transmission systems.
5 References
[1] Houldsworth J.A. and Grant D.A.: ‘The use of harmonic distortion to increase the output of a three-phase PWM inverter’, IEEE Transactions of the Industry Applications Society, Sept 1984, pp 1224-1228
[2] Ramiar Alaei and S. Ali Khajehoddin.: ‘The Operation of a Power Transmission Line With Injected Third Harmonic Voltage’, IEEE Transactions On Power Delivery, Vol. 32, No. 1, February 2017, pp 226-233
[3] Grant, D.: 'Apparatus and Method of Control for Increasing the Power Capability of an Electrical Power Transmission System’. PCT Application WO/2021/053340, March 2021
[4] ‘Choosing how to benefit from Triple Harmonic Injection (THI)’,https://www.powermaximiser.com/resources/, accessed 3 October 2022
[5] Minhu Xu et al.: ‘Measurement and Analysis of 220kV Overhead Transmission Line Parameters’, 2021 J. Phys.: Conf. Ser. 1754 012078
Duncan Grant
11/12/22